I'm Cao Jiang, co-founder of Omni-Growth Agent, an AI overseas marketing agent. I'm also a co-founder and CTO of Sensors Data. After my previous article on 300 DTC failures went out, the single most common question I got back was:
"My site — or the site I want to build — does it land on the dead side or the alive side?"
That article couldn't answer it, because it was about how brands die, not what the survivors look like. Knowing the cause of death isn't the same as knowing the conditions for survival. Most plane crashes are human error, but you can't reverse that into "if the pilot makes no mistakes, the flight is automatically safe" — the flights that landed safely also did a stack of things right that we never see.
So I had the agent do a second thing: put 154 dead DTC brands and 20 surviving ones side by side, and run the same comparison on both.
When the comparison came back, three survival factors stood out cleanly.
The most striking numbers first:
- Repeat frequency: 45% of surviving brands sit in high-frequency repeat categories, versus 21% for the dead group — more than a 2x gap.
- Traffic structure: 82% of dead brands hit "single-channel traffic" (mostly Facebook Ads); 0% of surviving brands relied entirely on a single paid channel — not one.
- Gross margin: survivors averaged 60.1%; Allbirds was at 47% when it died.
Three survival factors — repeat purchase × owned traffic × unit economics. This article covers how to measure each of these three lines, and why 34 brands in supposedly "high-repeat" categories died anyway.
1. How the Survivors Were Compared Against the Dead
The death group reuses the 154 cases I compiled in the previous article. Its core finding: 95.5% of dead DTC brands hit "single-channel traffic plus missing repeat purchase."
The survival group is 20 DTC brands pulled from public data that weathered the iOS 14 shock — Chewy, Gymshark, Warby Parker, Bravo Sierra, and others — then placed alongside the 154 dead cases and compared on the same axes.
These 20 aren't all "perfect brands." Some are still struggling (Glossier was still laying people off in 2026); some survive on acquisition life support (MVMT sold to Movado). But the thing they share is the thing that matters: all of them survived the death wave after iOS 14, and all are still operating today.
The death-group data comes from the previous article's compilation; the survival-group data again comes from S-1s, 10-Ks, and public media reports — so every number traces back to a public source.
2. How the AI Agent Built the Comparison
2.1 Feature Extraction on the Death Group
First I had the agent label the 154 dead cases on three dimensions:
- Category repeat tier: repeat frequency inferred from category (beauty / pet / food = high-frequency; apparel = mid-frequency; consumer electronics / furniture / watches = low-frequency).
- Traffic signals: whether each case mentions SEO, organic traffic, owned audience, email, and the like.
- Unit-economics signals: extracted numbers like CAC, marketing-spend ratio, ROAS.
The three landmark cases from the previous article (Allbirds, Sunvalley/RAVPower, Outdoor Voices) got their specific CAC and LTV numbers added this time.
2.2 Deep Research on the Survival Group
For the 20 surviving brands, the agent ran deep-research mode to pull public data on each, focusing on these dimensions:
| Dimension | Source |
|---|---|
| Annual repeat frequency | S-1 / 10-K / media citations |
| Traffic structure (organic vs. paid) | SimilarWeb / public reporting |
| Gross margin | 10-K / S-1 / industry estimate |
| Average order value (AOV) | Financial filings / media |
| Annual revenue | Financial filings / media |
Of the 20 brands, 8 have public SEC filings (Chewy, Hims & Hers, Warby Parker, FIGS, On Running, YETI, Vital Farms, Olaplex); the other 12 use public media data plus industry estimates. Any non-public number is explicitly labeled "industry estimate," so the agent never fabricated data.
2.3 Same-Axis Comparison
The two datasets were aligned on three axes:
- Repeat frequency: the death group's category repeat tier vs. the survival group's actual repeat frequency.
- Owned-traffic capability: the death group's attribution distribution (81.2% hit "single-channel traffic" or "multi-factor") vs. the survival group's traffic-type distribution.
- Unit economics: the death group's gross margin and CAC signals vs. the survival group's gross margin and AOV.
3. Survival Factor One: Repeat Purchase
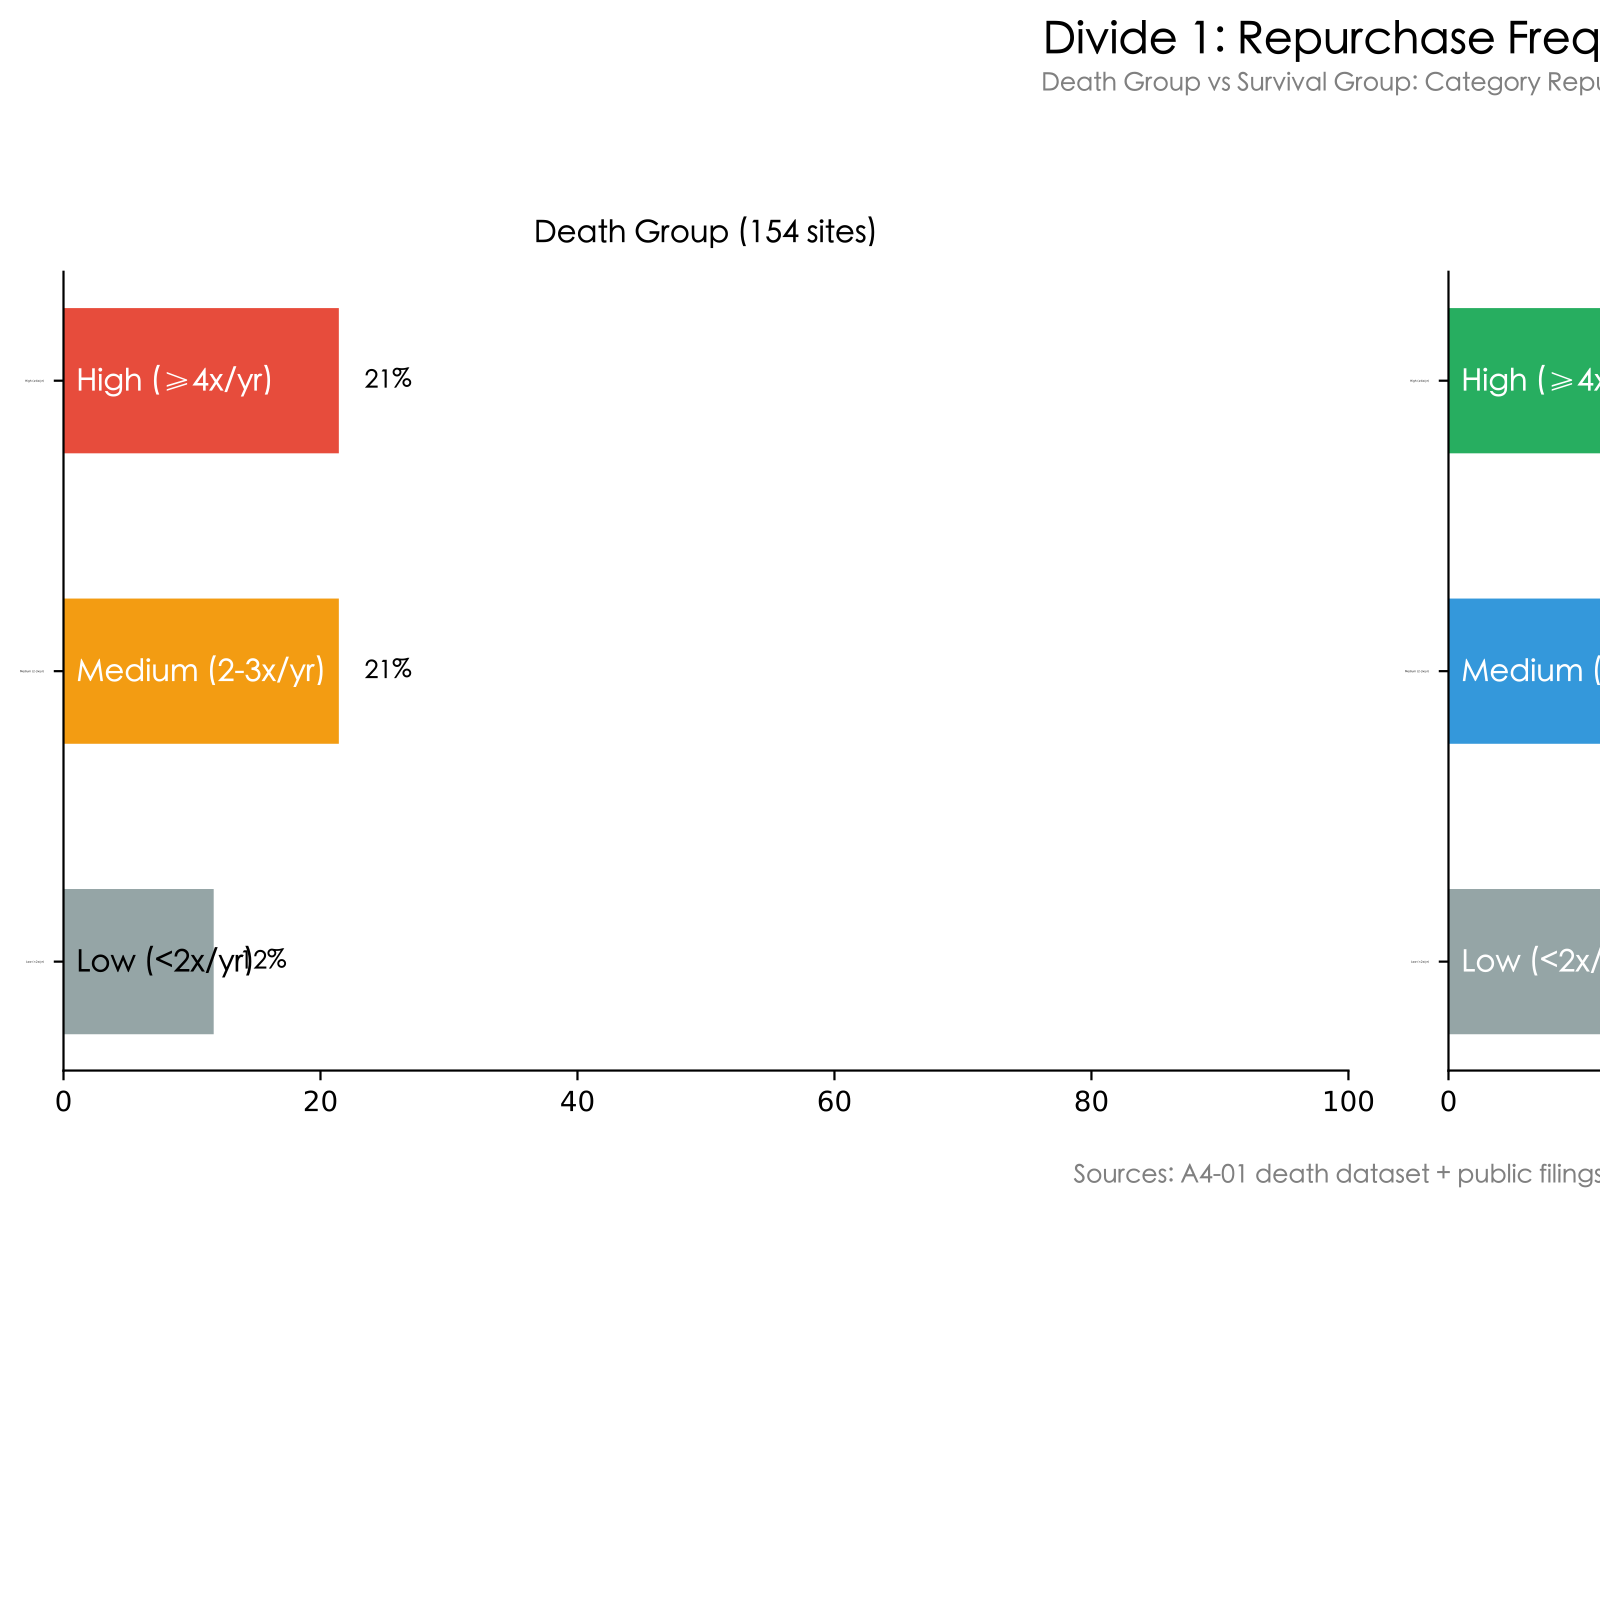
The gap jumps out of this chart.
In the death group, only 21% sit in high-frequency repeat categories (4+ purchases a year). High and mid-frequency are each 21%, low-frequency is 12%, and the remaining 45% are category-ambiguous and can't be classified.
The survival group? 45% are high-frequency repeat: Chewy, Hims & Hers, AG1, Bravo Sierra, Native, Liquid Death, Olipop, Vital Farms, Prose. 35% are mid-frequency, and only 20% are low-frequency.
On high-frequency share, the survival group is more than double the death group.
The contrast worth dwelling on is Outdoor Voices vs. Chewy.
Outdoor Voices repeated 1.2 times a year. Customers bought one pair of leggings and never came back. LTV $220, CAC ceiling $80. After iOS 14, activewear Facebook CAC climbed to $80-150, so acquiring each customer ate 40-70% of LTV. It closed all 16 stores in March 2024.
Chewy repeats 8 to 12 times a year. Its Autoship model auto-ships pet food every 4-8 weeks. Annual spend per customer is $583. Its gross margin is only 29.2%, far lower than Outdoor Voices' — but its repeat frequency is 8x that of Outdoor Voices, so LTV comfortably carries CAC. 2024 revenue: $11.86B.
The same single axis — repeat frequency — an 8x gap, and the outcome is one dead, one alive.
4. Survival Factor Two: Owned Traffic
We saw the death-group number in the previous article: 81.2% hit "single-channel traffic" or "multi-factor." Put plainly, traffic ran purely on ads, and once the ad budget stopped, there was no acquisition channel left.
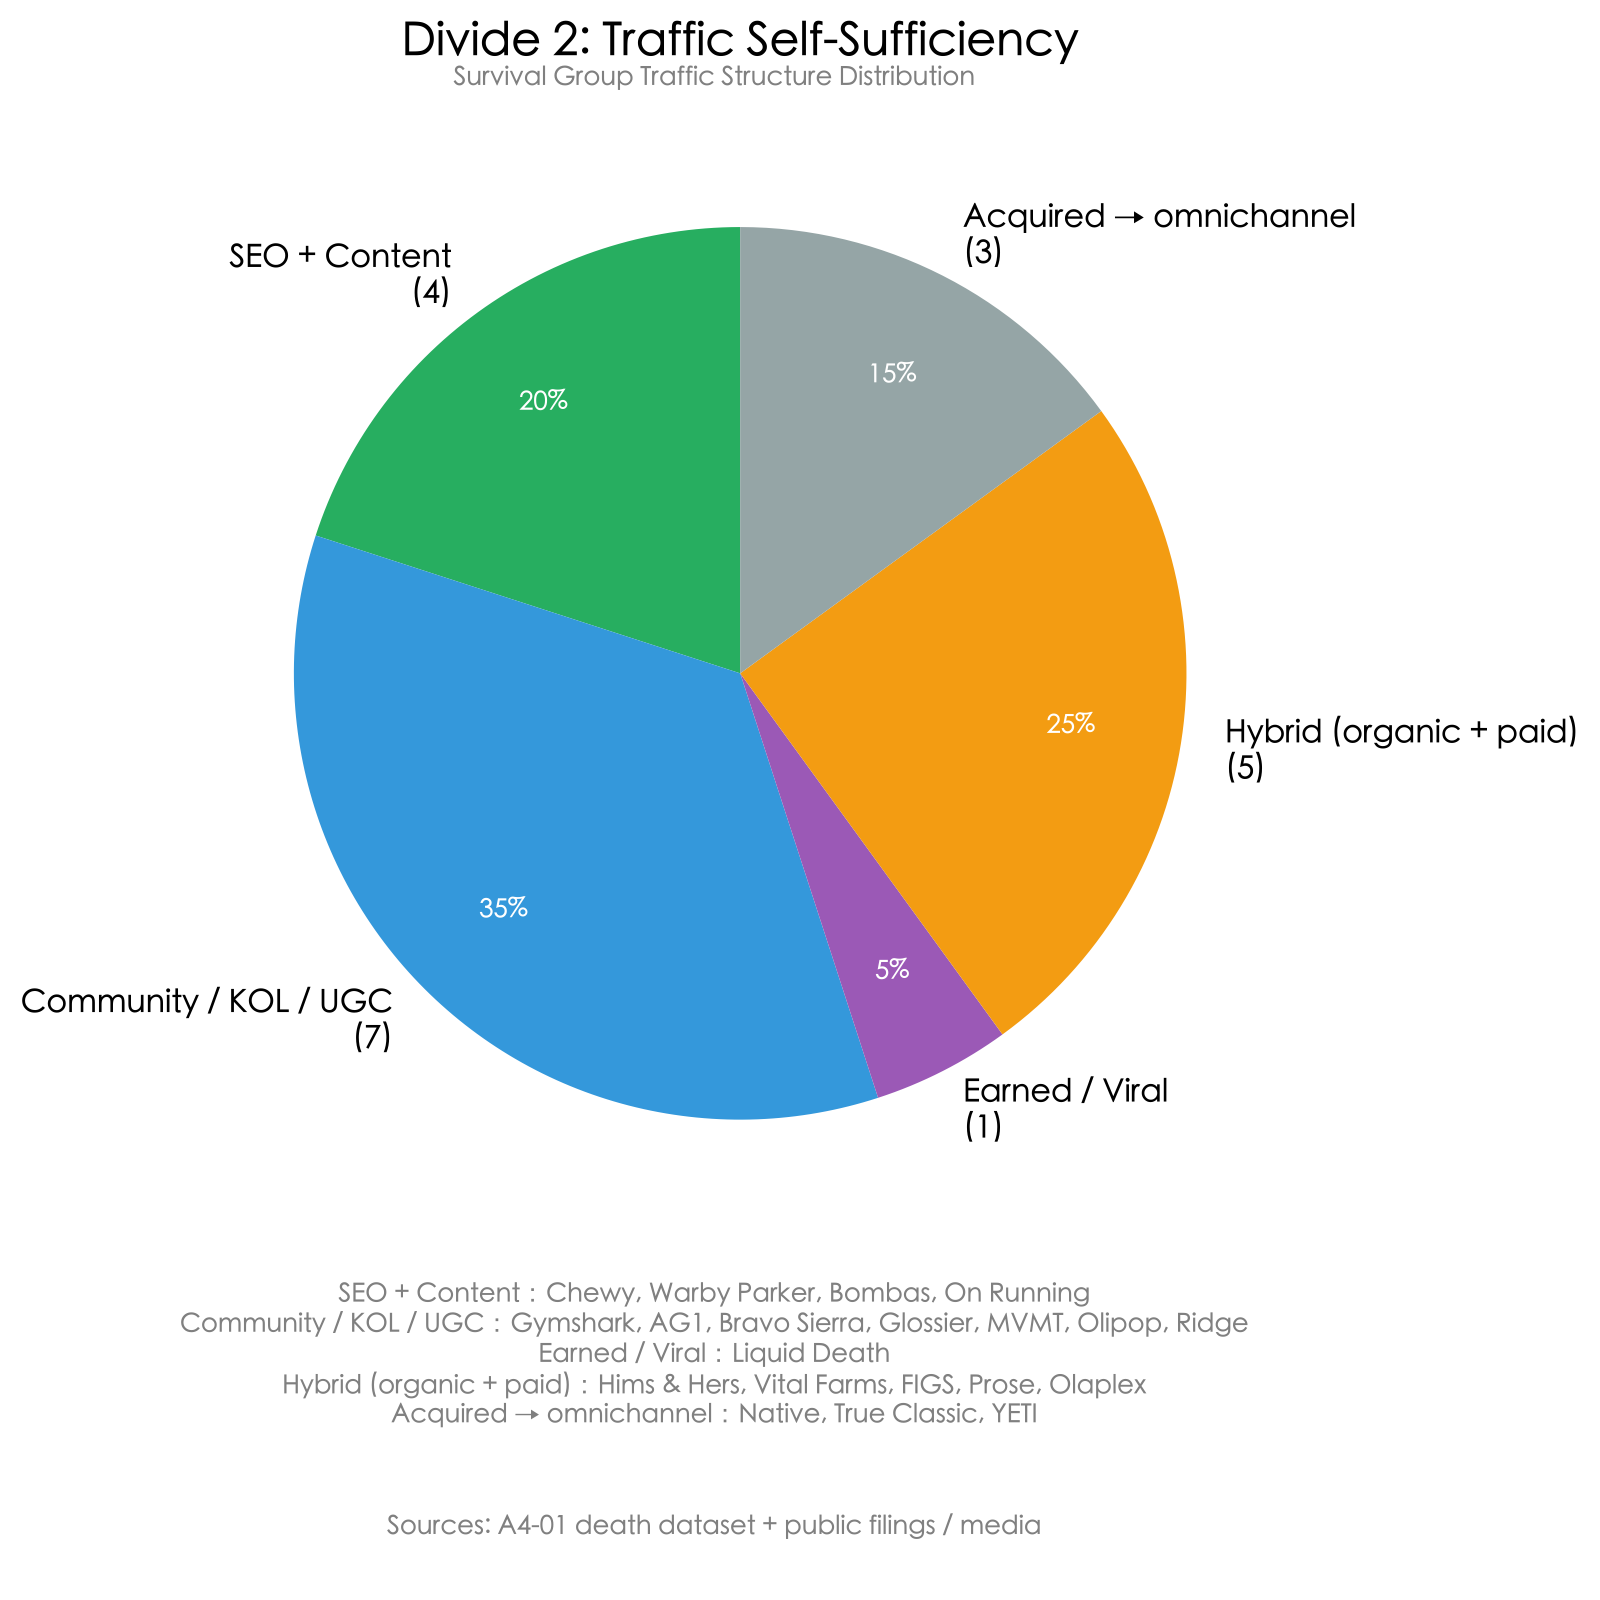
The survival group? Break down the traffic structure across the 20 brands:
- 35% on community / influencer / UGC (Gymshark, AG1, Bravo Sierra, Glossier, MVMT, Olipop, Ridge)
- 25% mixed, organic and paid in parallel (Hims & Hers, FIGS, Vital Farms, Prose, Olaplex)
- 20% on SEO + content (Chewy, Warby Parker, Bombas, On Running)
- 15% omnichannel after acquisition (Native, True Classic, YETI)
- 5% pure earned media (Liquid Death)
0% of surviving brands relied entirely on Meta paid ads for acquisition — not a single one.
Now another contrast: Allbirds vs. Gymshark.
Allbirds' marketing ran 35-43% of revenue — for every $3 of revenue, $1 went to buying traffic. iOS 14 arrived, attribution broke, and the moment ads stopped, new-customer flow stopped. Its S-1 shows no SEO, no community, no brand-content asset of any kind. In April 2026 it sold itself for $39M; its IPO valuation had topped $4.1B — a 99% wipeout.
Gymshark's search traffic is 82% organic search — not paid clicks, but users actively searching the brand name. Since 2013 it has partnered with YouTube fitness creators and built an influencer community called "Gymshark Athletes." Not one-off ad buys, but long-term brand ambassadors. 2024 revenue: $863M, gross margin 55.2%.
Both are sportswear brands. One buys traffic, the other builds a traffic asset of its own. One's valuation fell 99%, the other earns $863M a year.
5. Survival Factor Three: Unit Economics
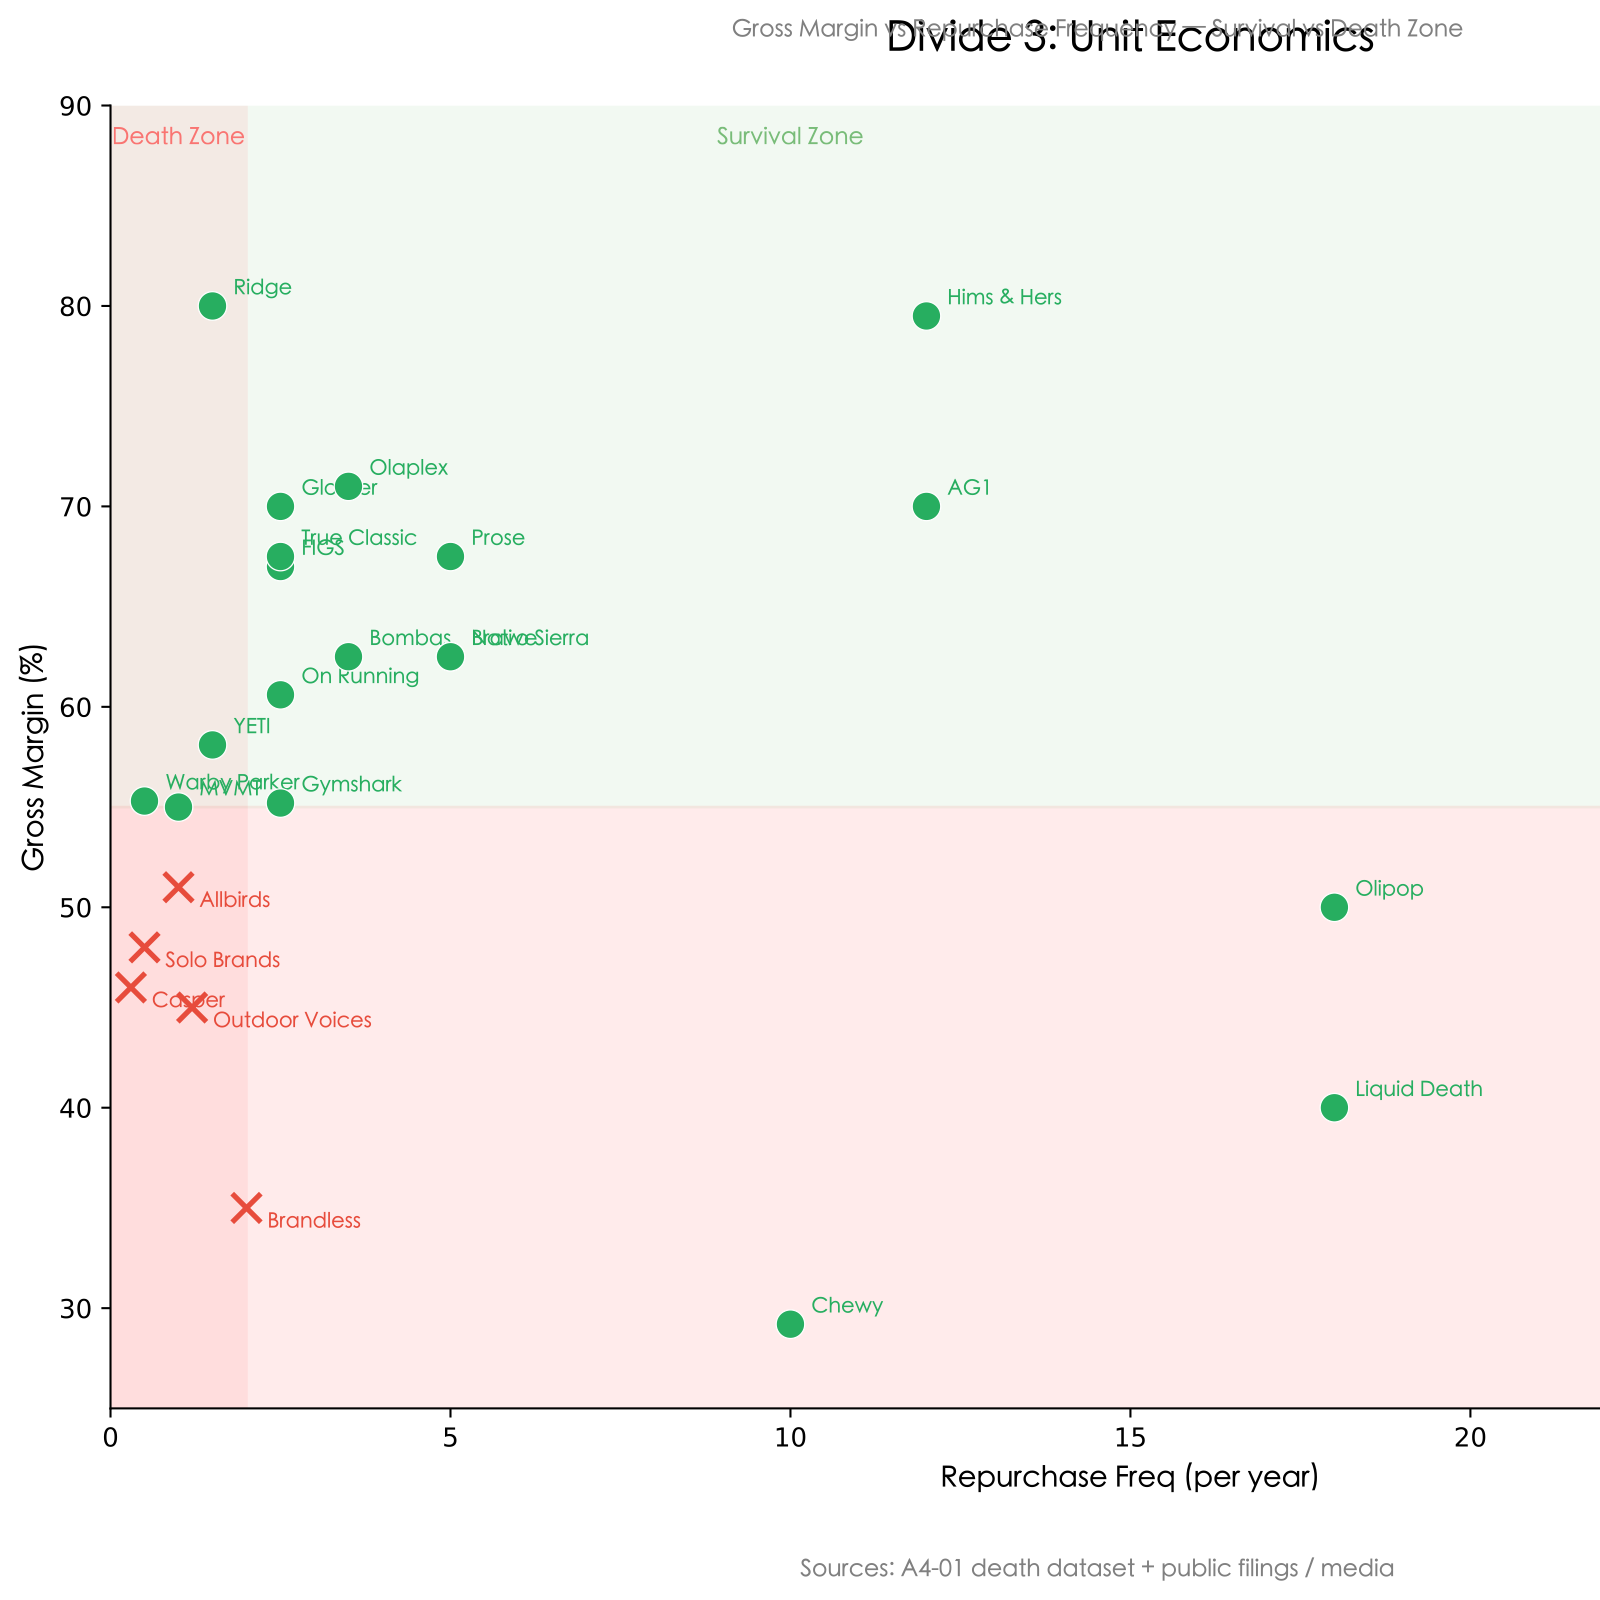
This is the chart I personally find most worth discussing.
The horizontal axis is annual repeat frequency; the vertical axis is gross margin. Green dots are the survival group, red crosses are the death group.
The survival zone is the top-right corner: high gross margin, high repeat frequency — broadly the safe zone. Ridge (80% margin), Hims & Hers (77-82% margin, 12x/year), and AG1 (70%+ margin, 12x/year) all sit here.
The death zone is the bottom-left corner: low gross margin, low repeat frequency — broadly the danger zone. Allbirds (51% margin, 1x/year), Casper (46%, 0.3x), and Solo Brands (48%, 0.5x) all land in this region.
But 4 brands deserve separate attention: Chewy (29.2% margin), Liquid Death (40%), Olipop (50%), and Vital Farms (37.9%). Their gross margins are all below 55%, yet they're all alive.
Why? Because their repeat frequency is 8 to 52 times a year.
Low margin won't necessarily kill you, but low margin plus low repeat is a death notice. Between margin and repeat, you need at least one that can carry the weight.
6. Category Repeat Is Not Your Repeat — and Three Self-Check Questions
6.1 Three Self-Check Questions
By this point, you can run your own product and DTC site through a self-check.
Question 1: For your category, how many times a year does a customer buy?
| Answer | Read |
|---|---|
| ≥ 4x/year (consumables / subscription / refills) | ✅ Green |
| 2-3x/year (apparel / sportswear / personal care) | 🟡 Yellow: needs another axis to compensate |
| < 2x/year (shoes / watches / furniture / electronics) | 🔴 Red: must have 60%+ gross margin or a fast exit strategy |
Question 2: If you killed all paid ads tomorrow, how many new customers per month would you still get?
| Answer | Read |
|---|---|
| ≥ 40% of current new customers (have SEO / community / email / word-of-mouth) | ✅ Green |
| 10-40% (some organic traffic but unstable) | 🟡 Yellow: start building SEO, community, and email from day one |
| < 10% (almost entirely ad-dependent) | 🔴 Red: you're walking the death-group path |
Question 3: Can your gross margin × AOV absorb a $50-80 CAC?
| Answer | Read |
|---|---|
| Gross margin ≥ 60% and AOV ≥ $80 | ✅ Green |
| Margin ≥ 55% but AOV < $50, or high AOV but thin margin | 🟡 Yellow: needs repeat to spread the cost |
| Margin < 50% and repeat < 4x/year | 🔴 Red: the math can't win |
How to read the result:
- 3 greens: closer to the survival group — keep validating downstream and try to scale.
- 2 green, 1 yellow: doable, but start fixing the yellow item now.
- Any single red: pause — work out how to solve the red before you spend money.
- 2 or more reds: don't build the DTC site. That's a serious recommendation.
6.2 Why 34 "High-Repeat" Brands Still Died
The first question above is repeat. Plenty of people will think: then I'll just pick a recognized high-repeat category and the problem's solved, right?
The cross-border community does carry a few widely shared beliefs:
- "Pick the right category and you're halfway to success."
- "A high-repeat category guarantees a winning DTC site."
- "High AOV = good fit for DTC."
But the data says otherwise.
I pulled a specific cut from the death group: 34 DTC brands in "theoretically high-repeat" categories (beauty / pet / food / supplements) that died anyway.
Their cause-of-death distribution:
- Multi-factor: 67.6%
- Missing repeat purchase: 14.7%
- Product-fit miss: 8.8%
- Single-channel traffic: 2.9%
- Pricing misalignment: 2.9%
- Pricing / product-fit: 2.9%
A high-repeat category does not mean your site has high repeat.
Beauty is naturally high-frequency, yet Birchbox (the original beauty-subscription brand) still died. Meal kits are a weekly-frequency category, yet Blue Apron (which had IPO'd) still collapsed. Vitamins are a monthly-frequency category, yet Care/of was acquired by Bayer and then shut down.
Why? Because while these brands sat in high-repeat categories, their actual user retention was extremely low. Birchbox subscribers churned over 50% in 3 months. Blue Apron's monthly user churn reached 20% at one point. A naturally high-repeat category doesn't mean users come back.
Another counterintuitive datapoint: low-frequency categories are only 12% of the death group. Most dead DTC sites didn't die from picking a low-frequency product — they died inside mid-to-high-frequency categories, without ever building the repeat.
So the correct reading of factor one isn't "pick a high-frequency category" — it's "whatever your category, have you built the repeat mechanism?"
Chewy built it (Autoship), AG1 built it (30-day auto-subscription), Prose built it (an AI formula that gets more accurate the longer you use it) — and they lived. Birchbox didn't, Blue Apron didn't — and they died.
This is also why a single-store diagnostic matters more than category-level intuition. I've written elsewhere about why a traceable audit trail is non-negotiable when an AI agent makes consequential decisions — every number in this comparison traces back to S-1s, 10-Ks, or public reporting for exactly that reason.
Frequently Asked Questions
What are the 3 factors that decide whether a DTC brand survives?
Repeat purchase, owned-traffic capability, and unit economics. When an AI agent compared 154 dead and 20 surviving DTC brands on the same axes, the survival group had 45% of brands in high-repeat categories versus 21% for the dead group, 0% of survivors relied entirely on a single paid channel versus 82% of the dead group hitting "single-channel traffic," and survivors averaged 60.1% gross margin versus Allbirds at 47% when it died. The rule of thumb: satisfy two of the three and survival odds rise sharply; fail all three and you match the death profile.
Why do some DTC brands survive while most fail?
Knowing the cause of death isn't the same as knowing the conditions for survival, so we compared 20 brands that survived the post-iOS-14 wave against 154 that died, on identical axes. The difference isn't product or pricing — it's operating model: survivors built repeat-purchase mechanics, owned (non-paid) traffic, and unit economics that could absorb CAC. Brands that ran their DTC site purely on paid ads, with no SEO, community, or email, broke when attribution collapsed after iOS 14 and CAC climbed faster than LTV.
How much does repeat purchase matter for DTC survival?
It's decisive. The clearest contrast is Outdoor Voices versus Chewy. Outdoor Voices repeated 1.2 times a year, LTV $220, CAC ceiling $80; after iOS 14, activewear Facebook CAC ran $80-150, eating 40-70% of LTV, and it closed all 16 stores in March 2024. Chewy repeats 8-12 times a year via Autoship, $583 annual spend per customer; despite a low 29.2% gross margin, its repeat frequency is 8x Outdoor Voices' and easily carries CAC — $11.86B revenue in 2024. Same single axis, an 8x gap, one dead and one alive.
Is owned traffic really better than paid ads for DTC brands?
Yes, and the data is stark: 0% of the 20 surviving brands relied entirely on Meta paid ads, while 82% of the dead group hit "single-channel traffic" or "multi-factor." Survivors' traffic broke down as 35% community/influencer/UGC, 25% mixed organic-plus-paid, 20% SEO and content, 15% omnichannel after acquisition, and 5% pure earned media. Compare Allbirds (marketing 35-43% of revenue, no SEO or community asset, down 99% to a $39M sale) with Gymshark (82% of search traffic is organic brand search, an Athletes influencer community since 2013, $863M revenue at 55.2% gross margin).
How do unit economics decide which DTC brands live or die?
Plotting annual repeat frequency against gross margin, surviving brands cluster top-right (high margin, high repeat) — Ridge at 80% margin, Hims & Hers at 77-82% margin and 12x/year, AG1 at 70%+ and 12x/year. Dead brands cluster bottom-left — Allbirds (51% margin, 1x/year), Casper (46%, 0.3x), Solo Brands (48%, 0.5x). The exception that proves the rule: Chewy (29.2%), Liquid Death (40%), Olipop (50%), and Vital Farms (37.9%) all have sub-55% margin yet survive — because they repeat 8-52 times a year. Low margin alone is survivable; low margin plus low repeat is a death notice.
Is picking a high-repeat category enough to make a DTC brand succeed?
No — this is the most common myth. We pulled 34 dead DTC brands that sat in theoretically high-repeat categories (beauty, pet, food, supplements) and they still died: 67.6% multi-factor, 14.7% missing repeat purchase. Birchbox (beauty subscription) had over 50% subscriber churn in 3 months; Blue Apron (meal kits) hit 20% monthly churn; Care/of (vitamins) was acquired by Bayer and shut down. Category repeat is not the same as your repeat. Only 12% of the dead group were low-frequency categories — most died inside mid-to-high-frequency categories without building a repeat mechanism. The right reading of factor one is not "pick a high-frequency category" but "whatever your category, have you built the repeat mechanism?"
What should I do this week if my DTC self-check shows a red flag?
Run the three-question self-check. Question 1: how many times a year does your category get bought — 4+ is green, 2-3 is yellow (needs another axis to compensate), under 2 is red (you need 60%+ gross margin or a fast exit). Question 2: if you killed all paid ads tomorrow, how many new customers per month remain — 40%+ is green, 10-40% yellow, under 10% red (you're walking the death-group path). Question 3: can gross margin × AOV absorb $50-80 CAC — margin 60%+ and AOV $80+ is green, margin under 50% with sub-4x repeat is red. Any single red flag means pause and solve that flag before spending more; two or more reds means don't build the DTC site yet.
Next Step
One opinion, take what's useful. The "repeat purchase × owned traffic × unit economics" survival framework we sized in this comparison is also baked into Omni-Growth Agent's diagnostic logic. The "Online Performance" module reads your traffic structure (paid vs. organic share), and the "Channel Opportunity Scan" module surfaces whether you have un-tapped organic traffic channels — and the AI agent tells you, directly, where your DTC site lands on these three lines.
The self-check above only gives you a rough read; the diagnostic report runs a far more detailed analysis on your real data. If you're running overseas marketing today, you can run a free AI agent audit on your own accounts.